The Event System: Real-Time Hooks for AI Observability
Hook into every stage of NeuroLink's AI pipeline with typed events. Monitor generations, streams, tool calls, and MCP connections in real-time.
We built NeuroLink’s event system to solve an observability problem that request-response logging cannot: understanding what happens inside a multi-step AI pipeline. When a generation triggers three tool calls, each taking different durations, followed by a streaming response, you need visibility into every stage – not just the final result.
The design decision was to build on Node.js EventEmitter with a typed surface via TypedEventEmitter<NeuroLinkEvents>. This keeps lifecycle notifications in-process instead of requiring external observability infrastructure. The trade-off is that event handlers run synchronously and must not block the pipeline. The interface documents the listener-management methods and provides IDE autocompletion for the built-in event names; event payloads are typed as unknown, so handlers should narrow them before reading fields.
This deep dive covers the event architecture, every event category, real-time dashboard patterns, and best practices for production event handler management.
Event System Architecture
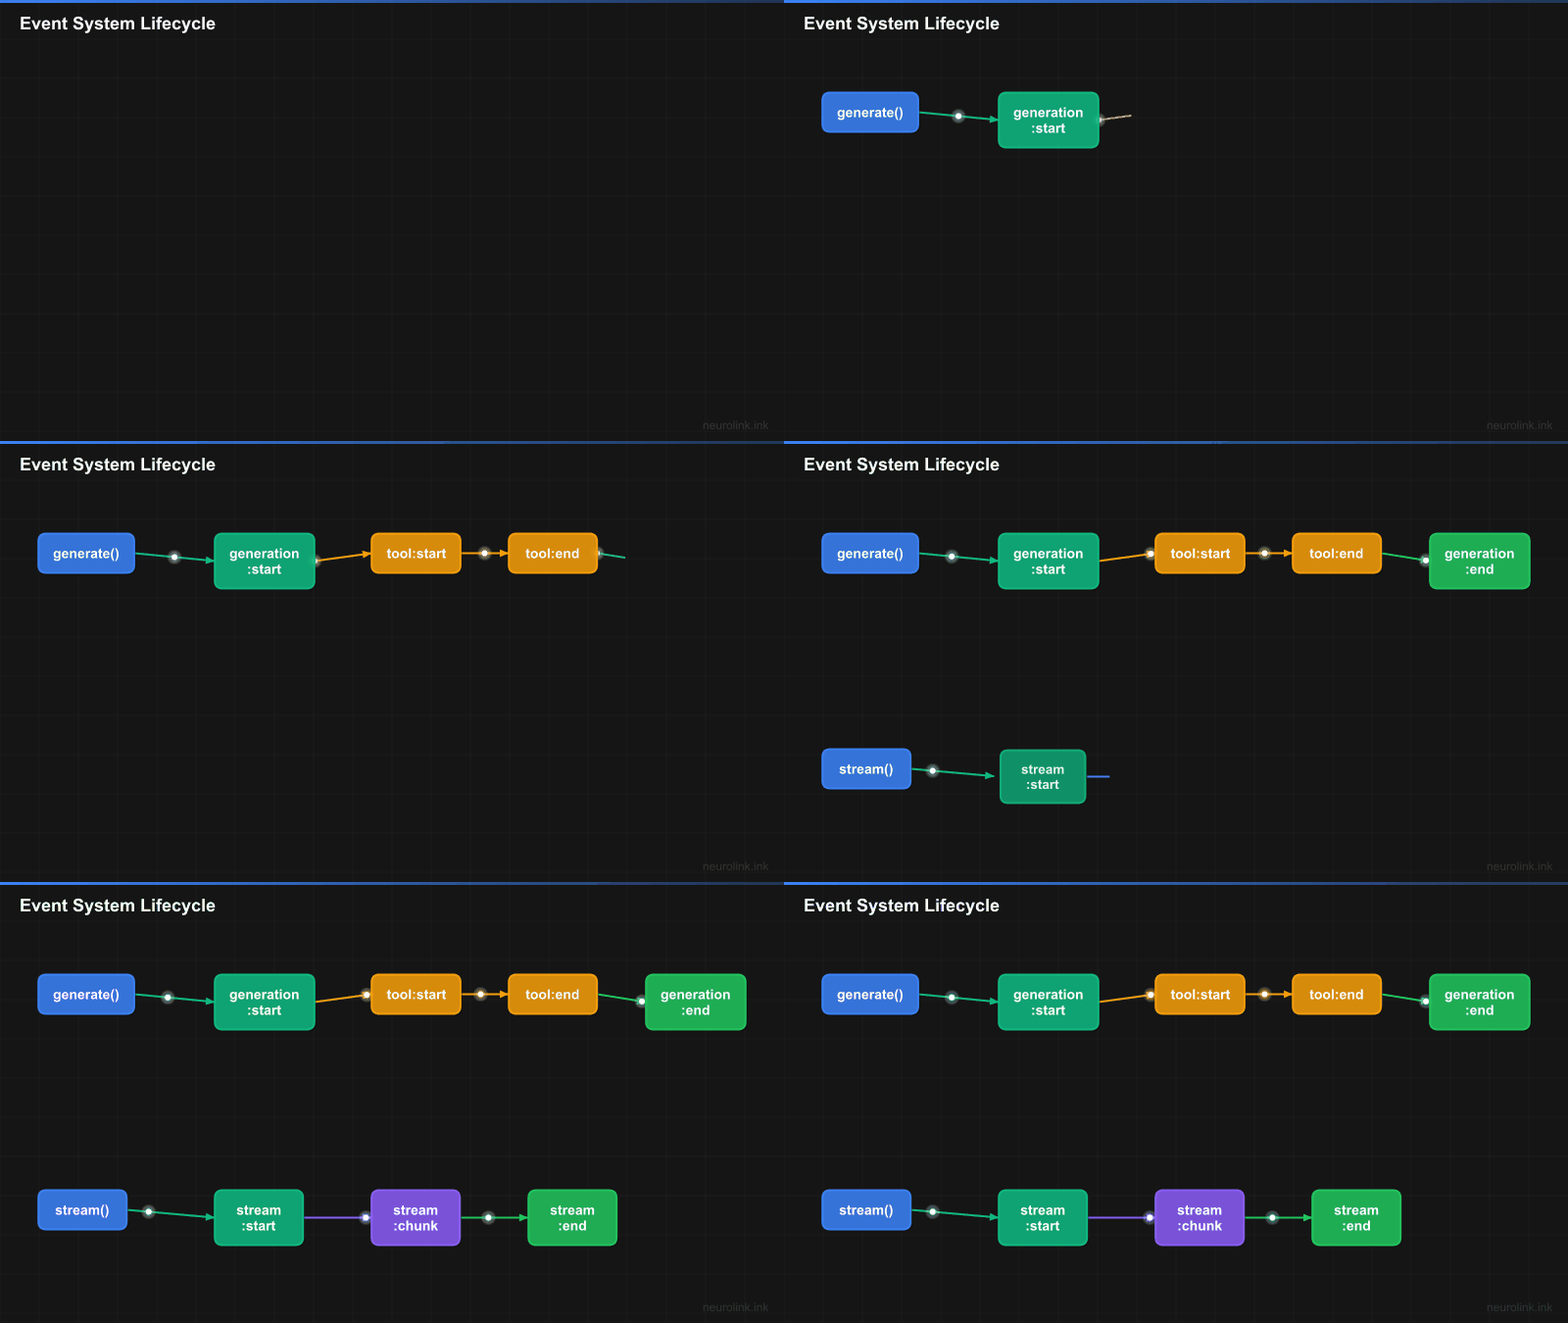
NeuroLink’s event system covers three pipelines: generation, streaming, and MCP connections. Each pipeline emits lifecycle events that your handlers can consume.
flowchart TD
    A[neurolink.generate] --> B[generation:start]
    B --> C[tool:start]
    C --> D[tool:end]
    D --> E[generation:end]

    F[neurolink.stream] --> G[stream:start]
    G --> H[stream:chunk]
    H --> H
    H --> I[stream:complete]
    I --> J[stream:end]
    H -.->|Error| K[stream:error]

    L[MCP Server] --> M[externalMCP:serverConnected]
    L --> N[externalMCP:toolDiscovered]
    L -.-> O[externalMCP:serverFailed]
    L --> P[externalMCP:serverDisconnected]
Call neurolink.getEventEmitter() to access the typed emitter. Its public interface includes on(), off(), emit(), removeAllListeners(), listenerCount(), and listeners().
Events are synchronous by default, following Node.js EventEmitter behavior. When an event fires, all registered handlers execute in the order they were registered, before the next line of code continues. This means event handlers should be fast – heavy processing should be queued for async execution rather than blocking the pipeline.
The event map is extensible: the [key: string]: unknown index signature allows custom event names beyond the built-in set. This lets you define application-specific events without modifying the SDK.
Event Categories
Generation Events
Generation events bracket the neurolink.generate() call, providing timing and metadata for every AI generation.
1
2
3
4
5
6
7
8
9
10
11
12
13
14
15
16
17
import { NeuroLink } from '@juspay/neurolink';

const neurolink = new NeuroLink();
const events = neurolink.getEventEmitter();

events.on("generation:start", (data) => {
  console.log("Generation started:", data);
});

events.on("generation:end", (data) => {
  console.log("Generation completed:", data);
});

const result = await neurolink.generate({
  input: { text: "Hello world" },
  provider: "google-ai",
});
The generation:start event fires when a generate call begins. Its current payload includes the provider and start timestamp, which are useful for request-volume tracking.
The generation:end event fires on success, failure, or cancellation. Its payload includes provider and response time, with result metadata on successful calls and error, success: false, and an aborted flag on failures or caller cancellation. This makes it the primary event for latency and outcome tracking.
Stream Events
Streaming events provide fine-grained visibility into the stream lifecycle, from initiation through every chunk to completion or error.
1
2
3
4
5
6
7
8
9
10
11
12
13
14
15
16
17
18
19
20
21
22
23
events.on("stream:start", (data) => {
  console.log("Stream initiated:", data);
});

events.on("stream:chunk", (event) => {
  // Event payloads are unknown; narrow before reading fields.
  if (event && typeof event === "object" && "content" in event) {
    process.stdout.write(String(event.content ?? ""));
  }
});

events.on("stream:complete", (data) => {
  console.log("Stream finished:", data);
});

events.on("stream:error", (error) => {
  console.error("Stream failed:", error);
});

const result = await neurolink.stream({
  input: { text: "Write a story" },
  provider: "google-ai",
});
The chunk, completion, and error payloads use the internal { type, content?, metadata?, timestamp } event shape, while stream:start and stream:end carry lifecycle metadata. Five events cover the full stream lifecycle:
stream:startfires once when the stream is initiated.stream:chunkfires for every received text chunk, so it can be a high-frequency event.stream:completefires when all chunks have been received and the stream ends normally.stream:endreports the end of the stream lifecycle.stream:errorfires if the stream encounters an error (network failure, provider error, timeout).
Note: The
stream:chunkevent fires at high frequency during active streams. If your handler performs expensive operations (database writes, HTTP calls), batch the chunks and process them periodically rather than on every event. A common pattern is to buffer chunks for 100ms and flush the buffer as a batch.
Tool Events
Tool events track the execution of tools called by the AI model during generation. These are essential for debugging tool selection, measuring tool performance, and building audit trails.
1
2
3
4
5
6
7
events.on("tool:start", (data) => {
  console.log("Tool invoked:", data);
});

events.on("tool:end", (data) => {
  console.log("Tool completed:", data);
});
The tool:end payload includes tool and toolName, plus fields such as responseTime, success, result, and error when the execution path provides them. This gives you visibility into tool calls:
- Which tools does the model call most frequently?
- Which tools are slow and might need optimization?
- Which tools fail often and might need better error handling?
- What results is the model receiving from tools?
Tool execution also integrates with NeuroLink’s private per-tool circuit breakers. Repeated failures can open a breaker for a specific server-and-tool key; applications can monitor the resulting failures through tool events, but the breaker map itself is not public API.
MCP Events
MCP events monitor the lifecycle of external MCP server connections: connections, disconnections, tool discovery, and failures.
1
2
3
4
5
6
7
8
9
10
11
events.on("externalMCP:serverConnected", (data) => {
  console.log("MCP server connected:", data);
});

events.on("externalMCP:toolDiscovered", (data) => {
  console.log("New tool discovered:", data);
});

events.on("externalMCP:serverFailed", (data) => {
  console.error("MCP server failed:", data);
});
The full set of MCP events covers the complete server lifecycle:
externalMCP:serverConnected– An MCP server has successfully connected and is available for tool calls.externalMCP:serverDisconnected– An MCP server has disconnected (graceful shutdown or connection loss).externalMCP:serverFailed– An MCP server connection attempt failed.externalMCP:toolDiscovered– A new tool has been discovered on a connected MCP server.externalMCP:toolRemoved– A tool is no longer available (server disconnected or tool unregistered).externalMCP:serverAdded/externalMCP:serverRemoved– Server configuration has been added or removed.
These events are critical for monitoring the health of your MCP infrastructure. If a tool server goes down, you want to know immediately – not when a user’s request fails because the tool is unavailable.
Building a Real-Time Dashboard
Combining all event categories, you can build a real-time operational dashboard with minimal code:
1
2
3
4
5
6
7
8
9
10
11
12
13
14
15
16
17
18
19
20
21
22
23
24
25
26
27
28
29
30
31
32
33
34
35
36
37
38
39
40
41
42
43
44
45
46
47
48
49
50
51
52
53
54
55
56
57
58
59
60
61
62
63
64
65
66
67
68
69
70
import { NeuroLink } from '@juspay/neurolink';

const neurolink = new NeuroLink();
const events = neurolink.getEventEmitter();

// Metrics collector
const metrics = {
  totalGenerations: 0,
  totalStreams: 0,
  totalErrors: 0,
  avgResponseTime: 0,
  responseTimes: [] as number[],
  activeStreams: 0,
  toolUsage: new Map<string, number>(),
};

// Generation tracking
events.on("generation:start", () => {
  metrics.totalGenerations++;
});

events.on("generation:end", (payload) => {
  if (!payload || typeof payload !== "object" || !("responseTime" in payload)) return;

  const responseTime = Number(payload.responseTime);
  if (Number.isFinite(responseTime)) {
    metrics.responseTimes.push(responseTime);
    metrics.avgResponseTime =
      metrics.responseTimes.reduce((a, b) => a + b, 0) /
      metrics.responseTimes.length;
  }
});

// Stream tracking
events.on("stream:start", () => {
  metrics.totalStreams++;
  metrics.activeStreams++;
});

events.on("stream:end", () => {
  metrics.activeStreams--;
});

// Error tracking
events.on("stream:error", () => {
  metrics.totalErrors++;
});

events.on("error", () => {
  metrics.totalErrors++;
});

// Tool tracking
events.on("tool:end", (payload) => {
  if (!payload || typeof payload !== "object" || !("toolName" in payload)) return;

  const toolName = String(payload.toolName);
  const count = metrics.toolUsage.get(toolName) || 0;
  metrics.toolUsage.set(toolName, count + 1);
});

// Periodic dashboard output
setInterval(() => {
  console.log("=== AI Dashboard ===");
  console.log(`Generations: ${metrics.totalGenerations}`);
  console.log(`Active streams: ${metrics.activeStreams}`);
  console.log(`Avg response: ${metrics.avgResponseTime.toFixed(0)}ms`);
  console.log(`Errors: ${metrics.totalErrors}`);
  console.log(`Tools:`, Object.fromEntries(metrics.toolUsage));
}, 10000);
This dashboard provides five key operational metrics:
- Total generations – How many AI requests have been processed? Useful for volume tracking and capacity planning.
- Active streams – How many streams are currently in progress? A sudden spike might indicate a resource leak.
- Average response time – How long do generations take on average? Increasing latency might indicate provider issues or prompt complexity growth.
- Error count – How many errors have occurred? A rising error rate triggers investigation.
- Tool usage – Which tools are called most frequently? This reveals AI behavior patterns and helps optimize the tool set.
In production, replace the console output with a metrics export to your observability platform (Datadog, Grafana, CloudWatch). The event handlers remain the same; only the sink changes.
Event-Driven Logging
Structured logging with events produces machine-parseable log entries that integrate with any logging infrastructure:
1
2
3
4
5
6
7
8
9
10
11
12
13
14
15
16
17
18
19
import { NeuroLink } from '@juspay/neurolink';

const neurolink = new NeuroLink();

// Structured logging for all events
events.on("log-event", (event) => {
  // Payloads are unknown at the public boundary; log the value as emitted.
  console.log(JSON.stringify(event));
});

// Error alerting
events.on("error", (error) => {
  const normalized = error instanceof Error ? error : new Error(String(error));
  sendToErrorTracker({
    message: normalized.message,
    stack: normalized.stack,
    context: { sdk: "neurolink" },
  });
});
The log-event is a general-purpose event that the SDK emits for significant internal activities. It produces structured JSON entries that can be parsed by any log aggregation tool: CloudWatch Logs, Datadog Logs, Elasticsearch, or Splunk.
The error event surfaces selected SDK errors when at least one error listener is registered. Routing these to an error-tracking service gives SDK-level failures the same operational path as application errors.
Note: Log events are structured JSON by design. Avoid converting them to formatted strings – the JSON format is what makes them searchable and aggregatable in log analysis tools. Store the raw JSON and use your logging platform’s query capabilities for analysis.
Listener Management
Proper listener management prevents memory leaks and ensures clean application shutdown.
1
2
3
4
5
6
7
8
9
10
11
12
13
14
15
// Add a listener
const handler = (data: unknown) => console.log(data);
events.on("generation:end", handler);

// Remove a specific listener
events.off("generation:end", handler);

// Remove all listeners for an event
events.removeAllListeners("generation:end");

// Check listener count
const count = events.listenerCount("generation:end");

// Get all listeners
const listeners = events.listeners("generation:end");
Four rules for listener management:
Always store handler references. When you call events.on("event", handler), store the handler reference so you can remove it later with events.off("event", handler). Anonymous functions cannot be removed.
Clean up in application shutdown. Use removeAllListeners() in your graceful shutdown handler to prevent event handlers from firing during teardown. This is especially important for handlers that write to external systems (databases, metrics services) that may already be shutting down.
Monitor listener counts. If listenerCount() grows unboundedly, you have a listener leak. This typically happens when code in a request handler registers a listener without removing it, causing one new listener per request.
Be selective with high-frequency events. The stream:chunk event can fire many times per stream. Make sure your handler can keep up under your expected concurrency or batch the events.
Best Practices
Keep event handlers fast. Event handlers execute synchronously on the main thread. A handler that takes 100ms to execute adds 100ms to every generation that fires that event. If you need to do heavy processing (database writes, HTTP requests, complex calculations), push the work to an async queue:
1
2
3
4
5
events.on("generation:end", (data) => {
  // Fast: just queue the work
  metricsQueue.push(data);
  // Do not: await db.insert(data) -- this blocks the pipeline
});
Never throw in event handlers. An uncaught exception in an event handler can crash the Node.js process. Always wrap handler bodies in try-catch:
1
2
3
4
5
6
7
8
events.on("tool:end", (data) => {
  try {
    recordToolMetric(data);
  } catch (error) {
    console.error("Metric recording failed:", error);
    // Swallow the error -- do not crash the process
  }
});
Use listenerCount() in tests. Verify that handlers are registered correctly in your test setup and removed correctly in your test teardown. Listener leaks in tests cause mysterious failures in subsequent test cases.
Consider batching for external systems. If you are sending events to Datadog, CloudWatch, or Elasticsearch, batch them rather than sending one HTTP request per event. Most observability platforms have batch APIs that are both more efficient and cheaper.
Test with stream:chunk volume. Load test your event handlers under realistic stream volumes to ensure they do not become a bottleneck.
Design Decisions and Trade-offs
We built the event system on Node.js’s standard EventEmitter rather than introducing a custom pub/sub mechanism. This means zero learning curve for developers who already know Node.js, but it also means in-process only – events do not cross process boundaries without explicit bridging to an external message bus.
The TypedEventEmitter surface makes the built-in event names discoverable while retaining an extensible string index for custom events. Payloads remain unknown, so narrowing at the handler boundary is what prevents a wrong payload assumption from silently producing incorrect metrics.
Start with logging events for debugging, add metrics for operational dashboards, then build reactive workflows that respond to tool failures, stream errors, and MCP disconnections in real-time.
- Event-Driven AI Architecture – Build reactive AI systems using events as the foundation
- MCP Server Tutorial – Build custom tools and monitor them with MCP events
- Configuration Deep Dive – Tune the SDK configuration that affects event behavior
Related posts: